satlas.profiles.Gaussian
-
class
satlas.profiles.Gaussian(fwhm=None, mu=None, amp=None, ampIsArea=False)[source]¶ A callable normalized Gaussian profile.
-
__init__(fwhm=None, mu=None, amp=None, ampIsArea=False)[source]¶ Creates a callable object storing the fwhm, amplitude and location of a Gaussian lineshape.
Parameters: - fwhm (float) – Full Width At Half Maximum, defaults to 1.
- mu (float) – Location of the center, defaults to 0.
- amp (float) – Amplitude of the profile, defaults to 1.
- ampIsArea (boolean) – Sets if the amplitude is the integral or the peakheight. Defaults to False.
Returns: Callable instance, evaluates the Gaussian profile in the arguments supplied.
Return type:
-
__call__(x)[source]¶ Evaluates the lineshape in the given values.
Parameters: vals (array_like) – Array of values to evaluate the lineshape in. Returns: Array of seperate response values of the lineshape. Return type: array_like Note
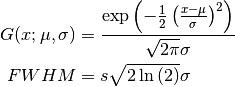
The used formula is taken from the MathWorld webpage http://mathworld.wolfram.com/GaussianFunction.html:
Methods
__init__([fwhm, mu, amp, ampIsArea])Creates a callable object storing the fwhm, amplitude and location of a Gaussian lineshape. Attributes
ampPeak amplitude. ampIsAreaBoolean controlling the behaviour of amp. fwhmFWHM of the peak. muLocation of the peak. -